Sample deliverable
The deliverable, in full.
A complete audit for a fictional company. Same structure every client gets, with tools, costs, and recommendations tailored to your situation. If your company is smaller, the audit would be simpler and the build cost lower.
DATA PLATFORM AUDIT
FINDINGS & RECOMMENDATION
Confidential
This document is the property of Verdure and is intended for internal use only.
Executive Summary
Nimzo Data conducted a two-week audit of Verdure's data environment, reviewing seven data sources, eight dashboards, and the workflows of three team members involved in data-related tasks.
The audit identified eight findings:
- Revenue figures are unreliable. No single system contains total reconciled revenue. Shopify, Stripe, GA4, and a manual spreadsheet each show different numbers, and the CFO and Head of Sales disagree on monthly revenue by tens of thousands of euros.
- Ad spend has no reliable attribution. Verdure spends approximately €200,000 per month on Google Ads and Meta Ads but cannot attribute revenue to specific channels because UTM tagging is inconsistent and GA4 session data is not connected to order data.
- Cross-market web analytics are fragile and incomplete. Five GA4 properties (one per market domain) are consolidated via a Google Sheets add-on with manual union tabs. This setup is unstable and time-consuming to maintain.
- Dashboards are not trusted. Eight Data Studio reports exist, but leadership does not trust them because each calculates metrics differently from different Google Sheets sources.
- The data analyst is a bottleneck. Emma spends roughly 35% of her time maintaining Google Sheets connectors, debugging GA4 exports, reconciling numbers, and building reports. She is the single point of failure for all data requests.
- Product margin analysis is manual and slow. Calculating margins requires a 3-hour Excel exercise joining Shopify orders to a supplier cost spreadsheet. A pricing decision on the spring collection was delayed two weeks.
- Email performance is unmeasured. Klaviyo claims ~18% of revenue comes from email, but this cannot be validated because email engagement data is not connected to order data.
- Customer LTV by acquisition channel is unknown. Budget allocation is based on short-term ROAS rather than long-term customer value because no system connects attribution data to purchase history.
We recommend a modern data platform built on Google Cloud: Airbyte Cloud for automated data ingestion, BigQuery as the central warehouse, Dataform for governed data transformations (a layer that cleans, standardizes, and applies consistent business logic to raw data), and Steep as the BI tool for self-service analytics. This architecture gives Verdure a single source of truth for revenue, marketing attribution, product margins, and customer lifetime value.
The estimated total cost for Year 1 is approximately €28,000, including the implementation fee and infrastructure (excluding the audit fee). From Year 2 onward, ongoing costs are approximately €8,400 per year, which is lower than what Verdure currently spends on manual labor alone. The platform is expected to pay for itself within the first year through recovered analyst time and improved marketing spend allocation.
If Verdure does nothing, the revenue discrepancy will persist, marketing budget allocation will continue without reliable attribution data, and the analyst will remain a bottleneck for any data request that goes beyond what the current Data Studio dashboards can answer.
Audit Scope
This audit was conducted in accordance with the scope defined in the Audit Proposal signed on February 18, 2026. The objective was to assess Verdure's current data environment and produce a recommendation for a target architecture, tool selection, and implementation plan.
| Client | Verdure B.V., Amsterdam |
| Audit period | March 3-14, 2026 |
| Conducted by | Antoine Anicotte, Nimzo Data |
| Systems reviewed | Shopify, Stripe, GA4, Google Ads, Meta Ads, Klaviyo, Google Sheets, Data Studio |
| People interviewed | Emma de Vries (Data Analyst), Joris ten Berg (Head of Operations), Lisa Bakker (Head of Marketing) |
Current State
Current architecture
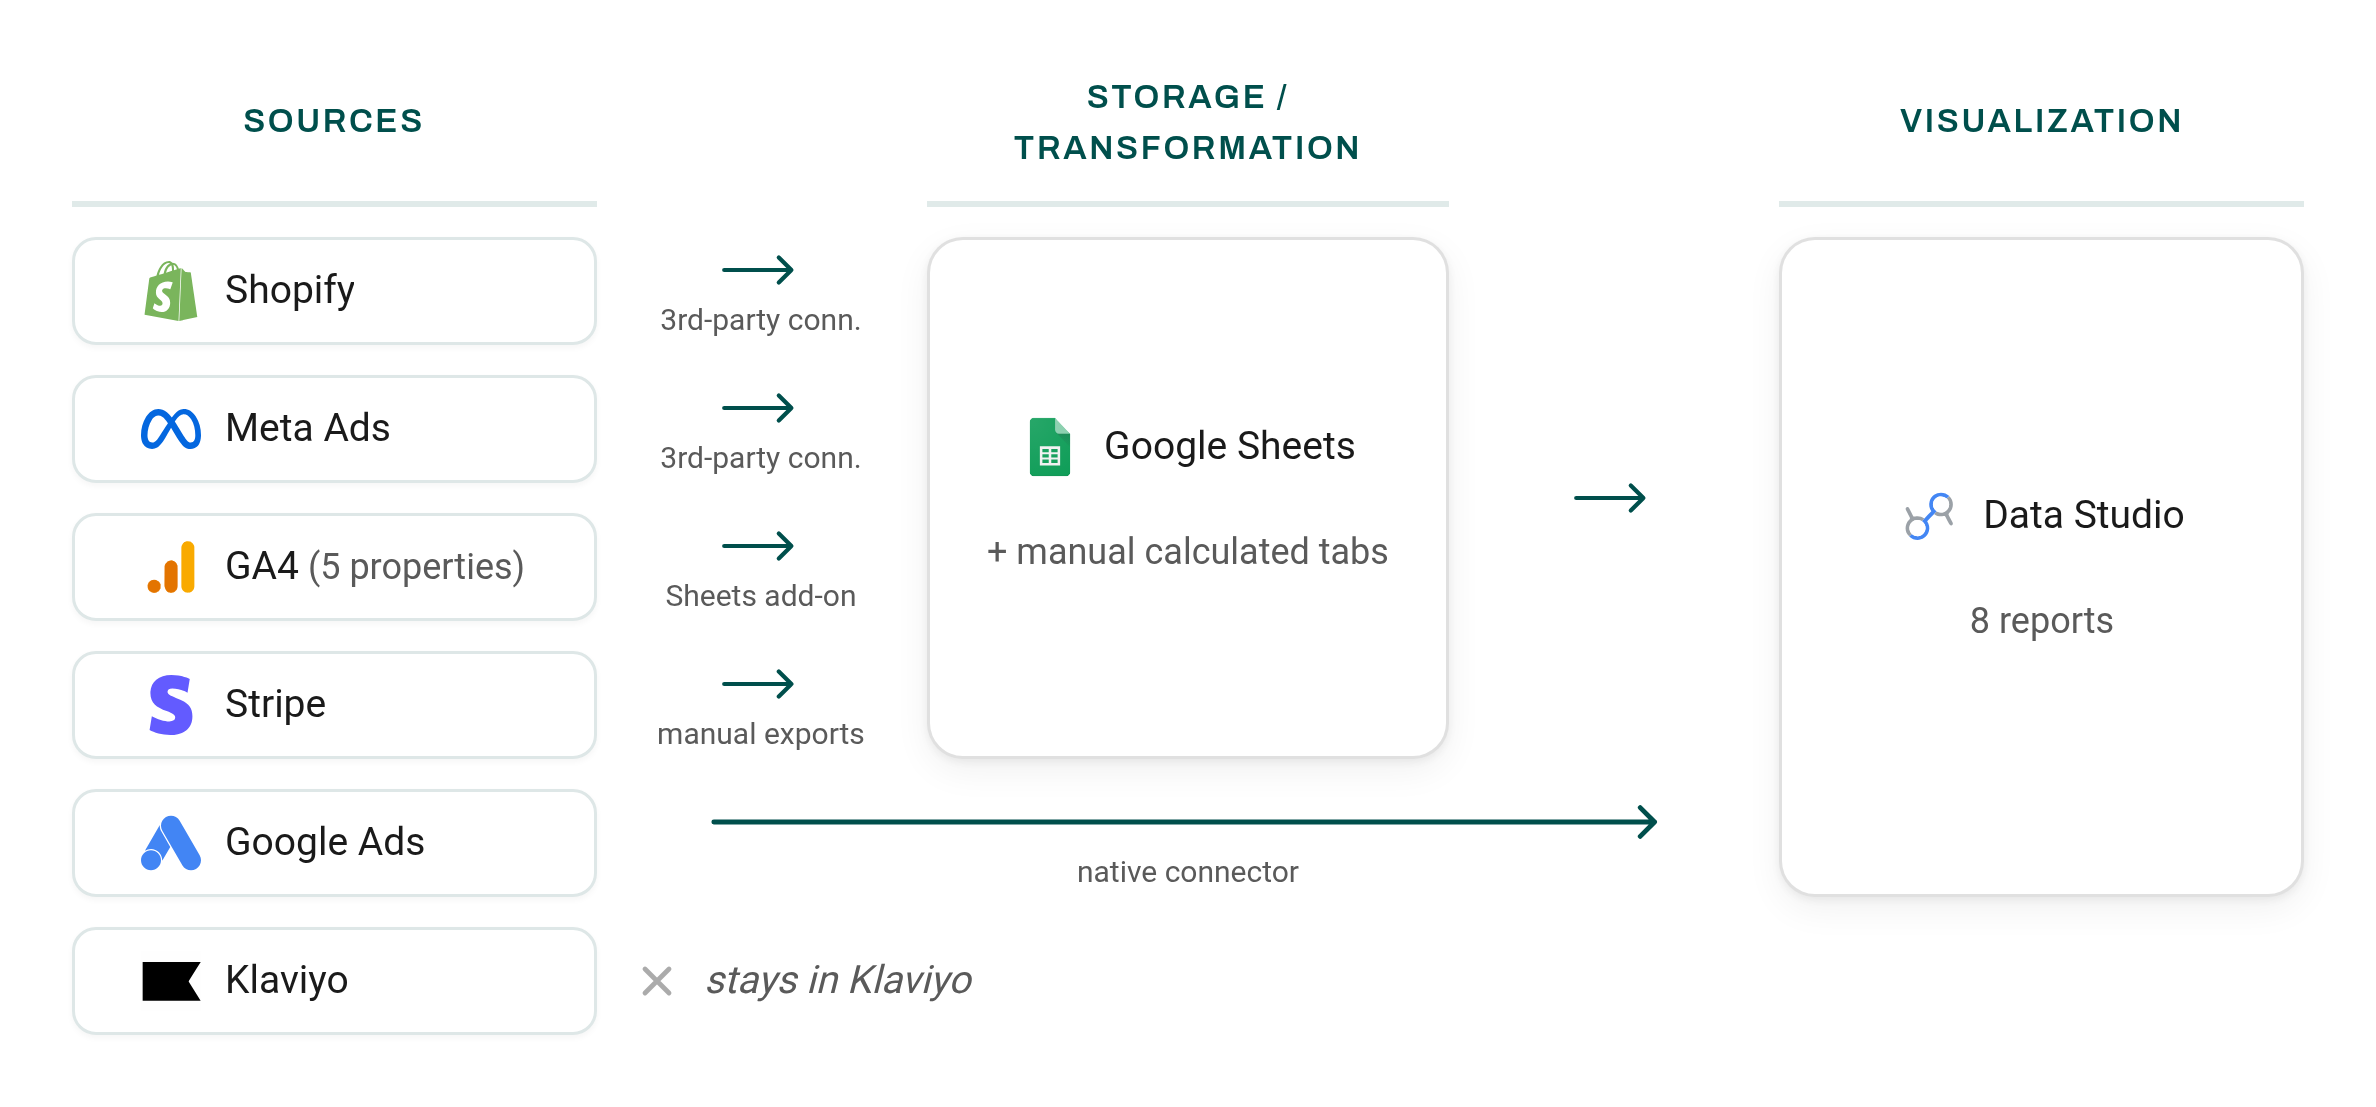
Data flows from seven sources into eight Data Studio reports through a patchwork of Google Sheets connectors, a Google Sheets add-on, one native Data Studio connector, and manual processes. There is no central data warehouse. The diagram below shows how each source reaches Data Studio today.
Data sources
Shopify
| Attribute | Details |
|---|---|
| Type | E-commerce platform (primary online store) |
| Data categories | Orders, products, customers, inventory, refunds, discounts, collections |
| Volume | ~12,000 orders/month, ~4,200 products, ~85,000 customer records |
| Current ingestion method | A third-party Google Sheets connector pulls Shopify data into Google Sheets daily. Emma adds calculated columns and summary tabs on top of the raw data tabs. Data Studio reads from these Google Sheets. Additional manual CSV exports for detailed data the connector does not cover (refund breakdowns, customer-level data). |
| Refresh frequency | Daily (automated via the Sheets connector). Manual CSV exports as needed. |
| Known issues | Refund data exported separately from order data; customer records contain ~8% duplicates from guest checkout; no connection between Shopify orders and Stripe payouts |
| API access | Shopify Admin API available (read access confirmed during audit) |
Stripe
Verdure uses Stripe alongside Shopify Payments for B2B wholesale invoicing and a small number of subscription-based orders. This dual payment setup is the root cause of Finding 1 (revenue discrepancy).
| Attribute | Details |
|---|---|
| Type | Payment processing (B2B wholesale invoicing and subscription orders processed outside the Shopify checkout). Most B2C and some B2B orders go through Shopify Payments. Stripe handles the remainder. |
| Data categories | Charges, payouts, refunds, fees, balance transactions, customers |
| Volume | ~800 transactions/month (B2B wholesale), ~€180,000/month in Stripe volume |
| Current ingestion method | Manual: Emma downloads payout reports from the Stripe dashboard weekly and imports them into a Google Sheet with reconciliation tabs |
| Refresh frequency | Weekly (Monday mornings, as part of Emma's weekly reporting routine) |
| Known issues | Stripe payout amounts don't match Shopify order totals due to: (1) timing differences between order placement and payout, (2) Stripe fees deducted from payouts, (3) refunds processed at different times, (4) GBP transactions converted at varying rates. This is the primary source of the revenue discrepancy between CFO and Head of Sales. |
| API access | Stripe API available (read access confirmed during audit) |
Google Analytics 4 (GA4)
| Attribute | Details |
|---|---|
| Type | Web analytics |
| Data categories | Sessions, events, conversions, traffic sources, user properties |
| Volume | ~350,000 sessions/month across 5 markets |
| Current ingestion method | GA4 Reports Builder add-on for Google Sheets. Each export is run 5 times (once per GA4 property: verdure.nl, verdure.de, verdure.fr, verdure.be, verdure.co.uk). Emma then maintains manual union tabs that consolidate the 5 property exports into one combined dataset. She adds calculated tabs on top for Data Studio to read from. This setup is repeated for each type of export (sessions, conversions, e-commerce, etc.). |
| Refresh frequency | Daily via the add-on, but exports frequently fail or return incomplete data. Emma debugs these regularly. |
| Known issues | The GA4 Reports Builder add-on is unstable and time-consuming to work with. With 5 properties, every export is 5× the configuration and 5× the potential failure points. The union tabs require manual maintenance whenever the add-on output changes. This approach was chosen because the native Data Studio GA4 connector cannot consolidate multiple properties. UTM parameters are not enforced across all campaigns, so ~40% of paid traffic appears as 'unattributed.' Enhanced e-commerce tracking is partially configured: purchase events fire but product-level data is inconsistent. |
| API access | BigQuery export available but not enabled |
Google Ads
| Attribute | Details |
|---|---|
| Type | Paid search and shopping campaigns |
| Data categories | Campaigns, ad groups, keywords, spend, clicks, impressions, conversions |
| Volume | ~€120,000/month spend across Search and Shopping campaigns |
| Current ingestion method | Native Data Studio connector for campaign dashboards. Lisa also checks the Google Ads interface directly for campaign management. |
| Refresh frequency | Near real-time via Data Studio connector. Monthly summaries copied into a Google Sheet for budget tracking. |
| Known issues | Google Ads conversion tracking reports different conversion counts than GA4 (attribution window differences). No connection between ad spend and actual Shopify orders. |
| API access | Google Ads API available |
Meta Ads (Facebook + Instagram)
| Attribute | Details |
|---|---|
| Type | Paid social advertising |
| Data categories | Campaigns, ad sets, ads, spend, impressions, clicks, conversions |
| Volume | ~€80,000/month spend across Facebook and Instagram |
| Current ingestion method | Third-party Google Sheets connector pulls spend and performance data into raw tabs daily. Emma adds calculated tabs on top. Data Studio reads from Emma's tabs. |
| Refresh frequency | Daily via the Sheets connector. |
| Known issues | Meta's reported ROAS is significantly higher than what Shopify order data suggests, due to Meta's self-attributed conversion model. The team cannot independently verify Meta's claims. |
| API access | Meta Marketing API available |
Klaviyo
| Attribute | Details |
|---|---|
| Type | Email marketing platform |
| Data categories | Campaigns, flows (automated sequences), subscriber profiles, email events (sends, opens, clicks) |
| Volume | ~65,000 subscribers, 12 active flows, 8-10 campaigns/month |
| Current ingestion method | None. Klaviyo data stays in Klaviyo. |
| Refresh frequency | N/A |
| Known issues | Klaviyo claims ~18% of revenue from email, but this cannot be validated because engagement data is not connected to Shopify order data. The team cannot measure email-driven LTV or identify which flows drive repeat purchases. |
| API access | Klaviyo API v2 available |
Google Sheets
| Attribute | Details |
|---|---|
| Type | Manual tracking and supplier cost data |
| Data categories | Supplier costs per product (COGS), weekly revenue summaries, ad spend summaries, metric definitions |
| Volume | 6 active spreadsheets, ~2,000 rows of product cost data |
| Current ingestion method | Manual data entry by Emma and the operations team |
| Refresh frequency | Weekly to monthly, depending on the sheet |
| Known issues | Supplier cost data is updated quarterly and often lags actual costs by 1-2 months. The product cost spreadsheet uses different product identifiers than Shopify (supplier SKU vs Shopify SKU), requiring manual matching. |
| API access | Google Sheets API available |
Cross-source dependencies and conflicts
Several critical problems exist at the intersection of sources:
- Shopify vs Stripe revenue: Shopify reports gross order value (€2.08M in February). Stripe reports net payouts after fees and refunds (€174,200 in February for B2B orders). These numbers cannot be reconciled without joining both datasets and accounting for: refund timing, Stripe processing fees (2.9% + €0.25), and GBP/EUR conversion rates applied at payout time.
- GA4 vs Google Ads conversions: GA4 reports 1,840 purchase events in February. Google Ads reports 2,150 for the same period. The discrepancy is due to different attribution windows and Google Ads counting view-through conversions that GA4 does not.
- Shopify product IDs vs supplier SKUs: The supplier cost spreadsheet uses supplier-assigned SKUs. Shopify uses its own internal product IDs. Matching costs to products requires a manual lookup table maintained by Emma (~2,000 rows, updated quarterly). Approximately 12% of products cannot be matched due to naming inconsistencies.
- Klaviyo vs Shopify attribution: Klaviyo claims email-attributed revenue based on opens/clicks within 5 days of purchase. Without joining these datasets, the team cannot distinguish between email-driven and organic purchases.
Data warehouse
Verdure does not currently have a data warehouse. All reporting is done via Google Sheets (which aggregate data from connectors, add-ons, and manual exports) connected to Data Studio. There is no central location where data from multiple sources can be joined, transformed, or governed.
Transformation layer
| Attribute | Details |
|---|---|
| Current approach | None. Business logic (revenue calculations, attribution rules) is embedded in individual Data Studio dashboards and Google Sheets formulas. |
| Version control | None |
| Testing | None |
| Documentation | None. Emma maintains a personal Google Sheet with metric definitions that is not shared with the broader team. |
| Metric definitions | Revenue defined differently in 4 places: Shopify admin (gross), Stripe dashboard (net B2B), Data Studio dashboard #3 (GA4 e-commerce), and the weekly summary spreadsheet. |
| Known issues | The absence of a transformation layer is the root cause of most findings in this audit. Without a shared layer that defines business logic once, every dashboard and spreadsheet calculates metrics independently. |
BI and reporting
| Attribute | Details |
|---|---|
| Current tool | Data Studio (formerly Looker Studio) |
| Number of dashboards | 8 active, 3 appear abandoned (not updated in 60+ days) |
| Users | ~15 people access dashboards regularly: CEO, CFO, Head of Ops, Head of Marketing, Head of Sales, 4 marketing team members, 2 sales team members, 2 product managers, Emma |
| Self-service capability | None. All dashboards were built by Emma. Ad-hoc requests go to Emma, who either builds a new dashboard or exports data to a Google Sheet. |
| AI / conversational analytics | None. No AI features in use. All ad-hoc data questions go through Emma, who manually pulls data and builds one-off analyses. |
| Mobile access | Data Studio reports can be viewed in a mobile browser but are not optimized for mobile. No native mobile app available on the free tier. |
| Known issues | Dashboard #3 (marketing performance) is powered by Emma's GA4 consolidation Google Sheet, which aggregates data from all 5 market properties. When the GA4 add-on exports fail or return incomplete data, Dashboard #3 shows stale or partial numbers until Emma debugs the issue. Dashboard #5 (weekly revenue) shows different totals than the CFO's weekly summary spreadsheet. CEO has stopped checking dashboards and asks Emma for numbers directly. |
Team and process
| Person / Role | Data responsibilities | Time spent on data |
|---|---|---|
| Emma de Vries, Data Analyst | Maintains all Google Sheets connectors and calculated tabs (Shopify, Meta Ads, GA4 consolidation). Downloads Stripe data weekly. Debugs GA4 add-on failures. Builds and maintains all Data Studio reports. Creates weekly revenue summary. Answers ad-hoc data requests. | ~14 hrs/week (~35% of time) |
| Lisa Bakker, Head of Marketing | Downloads ad spend reports from Google Ads and Meta Ads, maintains campaign tracking spreadsheet, reviews Klaviyo reports | ~4 hrs/week |
| Joris ten Berg, Head of Operations | Reviews weekly revenue summary, requests margin and inventory reports from Emma | ~2 hrs/week |
Total: approximately 20 hours per week spent on data-related tasks across three people. Of these, roughly 14 hours (Emma's contribution) are manual collection, export, and report-building work that would be automated by the recommended platform.
Current costs
| Component | Monthly cost | Annual cost | Notes |
|---|---|---|---|
| Shopify | €2,100 | €25,200 | Shopify Plus plan |
| Stripe | ~€5,050 | ~€60,600 | 2.9% + €0.25 on ~€174K/month B2B volume |
| GA4 | Free | Free | Standard GA4 property |
| Google Ads | Free | Free | Ad spend (€120K/mo) is not an infrastructure cost |
| Meta Ads | Free | Free | Ad spend (€80K/mo) is not an infrastructure cost |
| Klaviyo | ~€700 | ~€8,400 | 65K subscribers, email plan |
| Data Studio | Free | Free | Google Workspace included |
| Google Sheets | Free | Free | Google Workspace included |
| Manual labor (data tasks) | ~€3,100 | ~€37,200 | ~14 hrs/week at blended cost of ~€55/hr (Emma's time on manual data work) |
| Total | ~€11,000 | ~€131,400 | Excludes ad spend; includes Stripe processing fees |
Note: Shopify, Stripe, Klaviyo, and ad platform costs are operational costs that will not change as a result of this engagement. The relevant comparison for ROI is the manual labor line (€37,200/year) plus any new infrastructure costs introduced by the recommended platform.
Key Findings
The following findings emerged from the audit. Each finding connects to a specific recommendation in the next section.
Finding 1: Revenue figures are unreliable
Verdure has no single, reconciled revenue figure. Four systems report revenue, but each measures something different: Shopify reports gross order value for all channels (B2C and B2B). Stripe reports net B2B payouts after fees and refunds. GA4 reports browser-tracked e-commerce value (which undercounts by approximately 30-40% in the Netherlands due to ad blockers and consent management). And Emma's weekly summary spreadsheet attempts to combine these into a single number but cannot fully reconcile them because the underlying data is in separate, unconnected systems.
The core problem is not that these systems disagree — they measure different things and should show different numbers. The problem is that nobody has a single place where gross revenue, net revenue, and revenue by channel are calculated from the same source data using agreed definitions.
Impact: The CFO and Head of Sales disagreed on February revenue by €23,000. This discrepancy took Emma two days to investigate and partially reconcile. The CFO has requested that Emma produce a manual reconciliation every month, adding approximately 6 hours of work per month to an already full workload.
Finding 2: €200K/month in ad spend has no reliable attribution
Verdure spends approximately €200,000 per month on Google Ads (€120K) and Meta Ads (€80K). The marketing team uses platform-reported ROAS to allocate budget between channels. However, each platform self-attributes conversions using different models: Google Ads uses a 30-day click-through window with view-through conversions, Meta uses a 7-day click/1-day view window, and GA4 uses last-click attribution.
The result is that the sum of conversions reported by Google Ads + Meta Ads + Klaviyo exceeds actual Shopify orders by approximately 40%. The team cannot determine which channel genuinely drives profitable revenue because there is no independent attribution layer.
Additionally, UTM parameter enforcement is inconsistent: approximately 40% of paid sessions in GA4 appear as 'direct' or 'unattributed' traffic because campaign URLs were not tagged, or tagged inconsistently (e.g., 'google_ads' vs 'google-ads' vs 'Google Ads').
Impact: The marketing team cannot confidently answer whether shifting €20,000 from Meta to Google (or vice versa) would improve or harm revenue. Budget allocation decisions are based on platform-reported metrics that are known to overcount. At €2.4M annual ad spend, even a 5% improvement in allocation efficiency would recover €120,000 per year.
Finding 3: Cross-market web analytics are fragile and incomplete
Verdure operates five market-specific domains (verdure.nl, verdure.de, verdure.fr, verdure.be, verdure.co.uk), each with its own GA4 property. Emma has built a consolidation layer using the GA4 Reports Builder add-on for Google Sheets: each export runs 5 times (once per property), and manual union tabs combine the results into a single dataset. This is the only way to get cross-market data into Data Studio, because the native Data Studio GA4 connector does not support merging multiple properties.
This approach is unstable and time-consuming. The GA4 add-on is known in the industry to be unreliable, and with 5 properties, every export is five times the configuration and five times the potential failure points. Emma spends several hours per week maintaining and debugging this consolidation layer. When an export fails or returns incomplete data, the downstream Data Studio reports show stale or partial numbers until Emma fixes it.
Impact: Cross-market analytics exist but are fragile. Any question that compares markets (conversion rate by country, campaign performance across regions) depends on the Google Sheets consolidation working correctly. In BigQuery, this consolidation would be a single UNION ALL query that runs automatically every day.
Finding 4: Dashboards are not trusted
Verdure has eight active Data Studio reports, built at different times by Emma to serve different stakeholders. Each report pulls from different Google Sheets sources, each with its own calculated tabs and metric logic. Dashboard #3 (marketing performance) reads from Emma's GA4 consolidation Sheet. Dashboard #5 (weekly revenue) reads from a different Google Sheet with Shopify connector data plus manual Stripe imports. Dashboard #7 (sales overview) pulls from yet another Google Sheet maintained by the Head of Sales.
Impact: Leadership does not trust the dashboards because they regularly show conflicting numbers for the same metric. In the March board meeting, Dashboard #5 showed February revenue at €2.01M while the CFO's manual spreadsheet showed €2.03M. The board spent 20 minutes debating which number was correct instead of discussing growth strategy. The CEO has stopped checking dashboards entirely and asks Emma for numbers directly, which adds to her workload (Finding 5). Verdure invested time in building eight reports that leadership now bypasses.
Finding 5: The analyst is a bottleneck
Emma spends approximately 14 hours per week (35% of her time) on data infrastructure maintenance and manual reporting. The largest single block is Monday morning: checking that the Shopify and Meta Ads connectors ran correctly, verifying that the GA4 add-on exports completed for all 5 properties (and debugging when they didn't), downloading the Stripe payout report, cross-referencing Shopify and Stripe numbers to build the weekly revenue summary, and reviewing the Data Studio reports for anomalies. This process takes 5-6 hours.
Ad-hoc requests compound the problem. When the CEO asks 'what was our margin on the lighting category last quarter?', Emma must: export Shopify order data filtered by collection, match product IDs to the supplier cost spreadsheet (a manual lookup), calculate margin in Excel, and deliver the answer. This takes 2-3 hours for a single question.
Impact: Emma is the single point of failure for all data-related work. When she was on holiday for two weeks in January, no weekly reports were produced and three ad-hoc requests from the CEO went unanswered. The team's ability to make data-informed decisions depends entirely on one person's availability and manual labor.
Finding 6: Product margin analysis is manual and slow
Calculating product margin requires joining Shopify order data with supplier cost data from a Google Sheet. The supplier cost spreadsheet uses different product identifiers than Shopify (supplier SKU vs Shopify product ID), and approximately 12% of products cannot be matched without manual investigation.
The most recent margin analysis was requested for the spring collection pricing review. It took Emma three hours to produce and was delivered two weeks after the initial request because other reporting work took priority. By the time the analysis was ready, the Head of Product had already set prices based on estimates.
Impact: A pricing decision affecting approximately €800,000 in seasonal revenue was made without accurate margin data. The Head of Product estimated that better cost visibility could have improved margins by 2-3 percentage points on select items.
Finding 7: Email performance is unmeasured
Klaviyo reports that approximately 18% of Verdure's revenue is attributable to email marketing through flows (abandoned cart, post-purchase, win-back) and campaigns. This figure is based on Klaviyo's internal attribution model, which credits a sale to email if the customer opened or clicked an email within 5 days of purchase.
This attribution cannot be independently validated because Klaviyo engagement data (opens, clicks, flow triggers) is not connected to Shopify order data outside of Klaviyo. The team cannot answer: which email flows drive repeat purchases versus one-time conversions, whether the 18% figure overcounts (customers who would have bought anyway), or what the actual LTV of email-acquired customers is compared to paid or organic acquisition.
Impact: Verdure invests in 12 active email flows and 8-10 campaigns per month without reliable data on which flows generate the highest return. Optimizing email strategy requires connecting engagement data to actual purchase behavior, which is not currently possible.
Finding 8: Customer lifetime value by acquisition channel is unknown
Verdure cannot answer the question 'which acquisition channel produces the most valuable customers over time?' Answering it requires joining three datasets that currently live in separate systems: first-touch attribution data (from GA4), customer identity and order history (from Shopify), and email engagement (from Klaviyo). Without a central warehouse connecting these sources, each question about customer value requires weeks of manual work.
During the audit, we examined a sample of Shopify customer data and found early indicators that repeat purchase rates differ significantly by likely acquisition channel. Customers acquired through branded search appear to have a 2.3x higher repeat rate than those acquired through Meta prospecting campaigns. If confirmed at scale, this would mean Verdure's current budget allocation (which weights Meta heavily based on first-purchase CPA) may be systematically underinvesting in the channels that produce the most valuable customers.
Impact: At €2.4M annual ad spend, even a modest reallocation based on LTV data (shifting 10% of budget from low-LTV to high-LTV channels) could improve long-term revenue per customer acquired. Without LTV by channel, Verdure is optimizing for the cheapest first purchase rather than the most profitable customer relationship.
Quick Wins
The following improvements can be made immediately, independent of the larger implementation. They require minimal effort and deliver measurable results.
Standardize UTM tagging across all paid campaigns
Create a UTM naming convention document and update all active Google Ads and Meta Ads campaigns to follow it. Use lowercase, hyphens instead of underscores, and consistent source/medium values (e.g., utm_source=google, utm_medium=cpc for all Google Ads; utm_source=facebook, utm_medium=paid-social for all Meta). Google Ads supports an account-level tracking template, so UTM parameters can be set once and applied to all campaigns automatically. Meta Ads requires URL parameters to be added per campaign (using dynamic parameters like {{campaign.name}}), so enforcing consistency requires a campaign launch checklist.
Effort: 2-3 hours of Lisa's time to update active campaigns. Ongoing: enforce the convention for all new campaigns.
Impact: GA4 attribution coverage should improve from approximately 60% to 90%+ within one month. This data feeds directly into the attribution model in the recommended architecture.
Enable GA4 BigQuery export
GA4 offers a free daily export of raw event data to BigQuery. This can be enabled in the GA4 admin settings by linking each GA4 property to a Google Cloud project and configuring the BigQuery export. The export is not retroactive: data collection begins from the day it is enabled, so the sooner this is done, the more data will be available when the platform is built. All five market properties should be enabled.
Effort: 30-60 minutes. Requires a Google Cloud project (Verdure may need to create one if they do not have one already).
Impact: Once enabled, data begins accumulating in BigQuery immediately. This removes a dependency from Phase 1 of the implementation and means Verdure starts building a data asset today.
Create a shared metric definitions document
Convene a 90-minute meeting with the CFO, Head of Sales, Head of Marketing, and Emma. Agree on a single definition for the top 5 metrics: total revenue, net revenue, cost per acquisition, return on ad spend, and customer lifetime value. Document these in a shared Google Doc accessible to the entire leadership team.
Effort: 90 minutes of meeting time plus 1 hour for Emma to document.
Impact: Stops the conflicting-numbers problem immediately. These definitions will be encoded into the Dataform transformation layer during implementation, making them the permanent, governed source of truth.
Clean up the Shopify-supplier SKU mapping table
The supplier cost spreadsheet uses supplier-assigned SKUs that don't match Shopify's product IDs. Approximately 12% of products cannot be matched, which means margin analysis is incomplete for those items. Emma and the operations team should spend a session resolving the naming inconsistencies and establishing a naming convention for new products going forward.
Effort: 2-3 hours for Emma and one operations team member to resolve existing mismatches and document a naming convention.
Impact: Product margin coverage improves from ~88% to ~95%+. The Dataform product-cost model will have cleaner input data from day one of the implementation, reducing the amount of manual matching needed during the build.
Recommendation
Target architecture
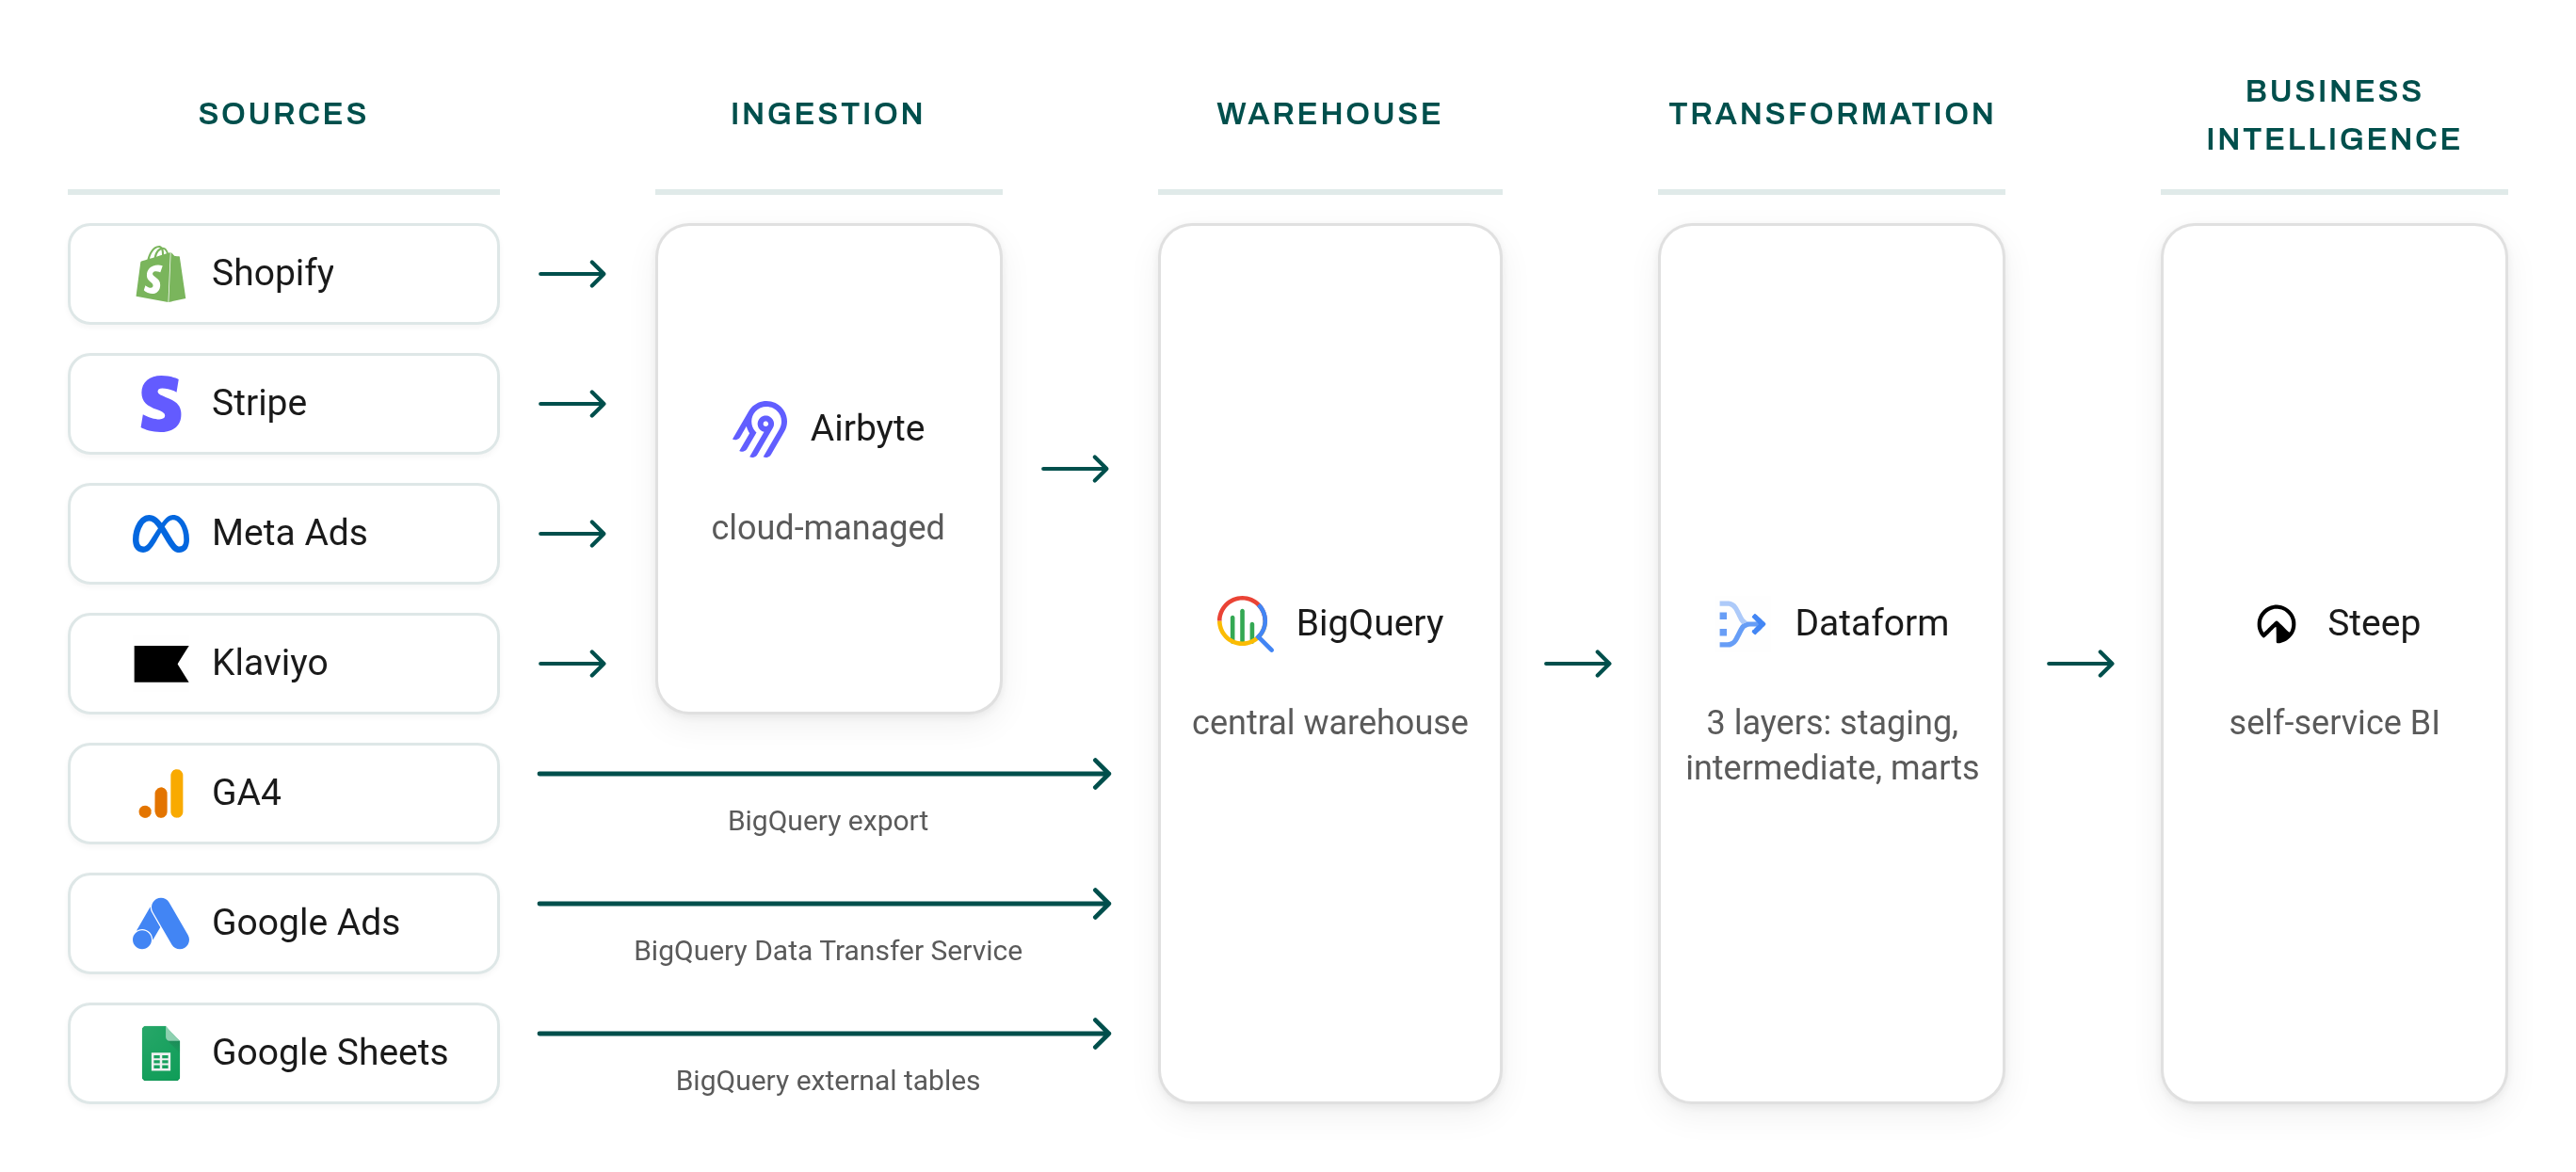
The recommended architecture has four layers:
- Ingestion: Data flows into BigQuery through three paths:
- GA4 raw event data exported directly via GA4's native BigQuery export (free, all five market properties)
- Google Ads data via BigQuery Data Transfer Service (free, native)
- Shopify, Stripe, Meta Ads, and Klaviyo via Airbyte Cloud
- Supplier cost spreadsheet connected as a BigQuery external table (always reads the latest version, no sync needed)
- Warehouse: BigQuery serves as the central data warehouse. All data from all sources lands here, making cross-source analysis possible for the first time.
- Transformation: Dataform applies business logic in three layers:
- Staging: clean and standardize each source's raw data
- Intermediate: cross-source joins (Shopify orders matched to Stripe payments, GA4 sessions matched to Shopify orders, Klaviyo events matched to customer purchase history, all five GA4 properties unified into a single dataset)
- Marts: the governed metrics that the business sees (revenue, attribution, margins, customer LTV), using the definitions agreed upon with leadership
- BI: Steep reads exclusively from the mart layer, so every metric every user sees is governed by a single set of definitions. Self-service exploration replaces ad-hoc requests to Emma. Steep's built-in AI is configured on the governed metrics, so team members can ask questions like 'what was our ROAS by channel last month?' and get answers grounded in the agreed definitions. Steep also exposes these metrics via MCP (Model Context Protocol), so the same governed data is accessible from AI tools the team already uses, like Claude or ChatGPT.
This architecture addresses all eight findings:
- Finding 1 (revenue discrepancy): Dataform reconciliation model joins Shopify orders and Stripe payouts, accounting for refunds, fees, and currency conversion. One revenue number across the company.
- Finding 2 (ad spend attribution): Dataform attribution model matches GA4 sessions to Shopify orders and compares against ad spend from Google Ads and Meta Ads. Campaign-level ROAS for ~60-70% of orders, channel-level ROAS for 100% of spend.
- Finding 3 (cross-market analytics): All five GA4 properties exported to BigQuery and unified via UNION ALL in Dataform, replacing the fragile Google Sheets consolidation.
- Finding 4 (dashboard trust): All Data Studio reports replaced by governed Steep views reading from a single set of metric definitions.
- Finding 5 (analyst bottleneck): Airbyte automates data collection. Dataform automates transformations. Steep enables self-service exploration for the entire team.
- Finding 6 (margin analysis): Dataform product-cost model joins Shopify orders to supplier costs via a maintained SKU mapping table. Real-time margin by product, category, and collection.
- Finding 7 (email attribution): Dataform joins Klaviyo engagement events to Shopify orders by customer ID. Validated email revenue attribution and LTV by email flow.
- Finding 8 (LTV by channel): Customer-level mart combines attribution data with Shopify order history, with a new-vs-returning flag. LTV by acquisition channel available as a self-service metric.
- AI-powered analytics: Steep's conversational AI is configured on top of the governed metrics, so team members can ask data questions in natural language without waiting for Emma or writing SQL. Steep's MCP server extends this to external AI tools, so the same governed answers are available wherever the team works.
Tool recommendations
Ingestion: Airbyte Cloud
Verdure has four data sources that need a managed ingestion tool: Shopify, Stripe, Meta Ads, and Klaviyo. All four have native Airbyte connectors. GA4 and Google Ads flow into BigQuery through free, native Google Cloud integrations (BigQuery Export and Data Transfer Service respectively). The supplier cost spreadsheet in Google Sheets is set up as a BigQuery external table, which reads the latest data directly without requiring a sync tool. Airbyte Cloud handles scheduling, monitoring, and schema change detection automatically.
At Verdure's data volumes (~12,000 Shopify orders/month, ~800 Stripe transactions/month), estimated Airbyte Cloud cost is approximately €150-200 per month. We considered Fivetran, which offers higher reliability guarantees but costs approximately €400-600 per month at this source count and volume. For Verdure's needs, Airbyte's reliability is sufficient and the cost savings are meaningful. This addresses Findings 5, 6, and 7 by automating the data collection that Emma currently does manually.
Warehouse: BigQuery
BigQuery is the natural choice for Verdure's GCP environment. GA4's native BigQuery export provides raw event data at no additional cost beyond storage. BigQuery's on-demand pricing model means Verdure pays only for queries executed, which at current anticipated volumes is estimated at €100-200 per month. There is no infrastructure to manage, and BigQuery scales automatically as data volumes grow. BigQuery is the foundation that addresses all eight findings by providing a single location where data from every source can be joined, transformed, and governed.
Transformation: Dataform
Dataform is GCP's native transformation tool, fully managed within BigQuery. It requires no additional infrastructure, no separate scheduling tool, and no additional licensing cost: Dataform is included in BigQuery, so the only cost is the BigQuery compute already estimated above. Dataform uses SQL with lightweight orchestration, which means Emma can read and understand the transformation logic without learning a new framework. Dataform is where the reconciliation, attribution, margin, and LTV models live, directly addressing Findings 1, 2, 3, 6, 7, and 8.
We considered dbt (an alternative transformation tool widely used in the industry). dbt offers more flexibility and a larger ecosystem, but introduces additional complexity: it requires either dbt Cloud (additional licensing cost) or dbt Core with a separate orchestrator. For a team without a data engineer, Dataform's zero-maintenance, GCP-native approach is the better fit. If Verdure later hires a data engineer who prefers dbt, the migration path from Dataform is straightforward.
BI: Steep
Steep is a metrics-first BI platform built around a semantic layer (a shared set of metric definitions that ensures every user sees the same numbers, regardless of which view or question they're exploring). Rather than building traditional dashboards, Verdure's data team defines governed metrics once (revenue, CPA, ROAS, LTV, margin), and every user in the organization explores those metrics through an intuitive interface without needing SQL knowledge. Steep includes AI-powered analysis on all paid plans and has a native mobile app, which addresses the CEO's and CFO's preference for checking numbers on their phones. As part of the implementation, we configure Steep AI with the metric definitions built in Phase 2, so conversational analytics work from day one at no additional cost, both inside Steep and via Steep's MCP server, which makes the same metrics available to external AI tools like Claude and ChatGPT.
At 15 users on the Business plan ($25/user/month), Steep costs approximately $375/month (€345/month). Steep directly addresses Findings 4 and 5: it replaces the untrusted Data Studio dashboards with governed, self-service analytics, and frees Emma from being the bottleneck for every data request. We evaluated three BI tools during the audit; the comparison follows below.
Tool comparison
The criteria below were selected based on Verdure's specific needs: a non-technical team that needs self-service analytics, a CFO who wants to check numbers on mobile, and no data engineer to maintain a complex BI setup.
| Criteria | Steep | Metabase Pro | Lightdash Cloud |
|---|---|---|---|
| Self-service for non-technical users | ●●●●● | ●●●○○ | ●●●●○ |
| Metric-first: users explore governed metrics, no SQL needed | Visual query builder works but ad-hoc exploration often requires SQL | Strong exploration interface, but better suited to teams with some technical comfort | |
| Mobile experience | ●●●●● | ●●○○○ | ●●○○○ |
| Native iOS/Android app with full functionality | Web responsive only, no native app | Web responsive only, no native app | |
| AI-powered analysis | ●●●●● | ●●●○○ | ●●●●○ |
| Steep AI included on all paid plans; MCP server exposes metrics to Claude, ChatGPT, and other AI tools | Metabot available via bring-your-own API key, adds friction and per-query cost | Built-in AI on Cloud plan, included in price | |
| Semantic layer (governed metrics) | ●●●●○ | ●●●○○ | ●●●●● |
| Native semantic layer, define metrics in UI or code | Models + Metrics layer exists but less mature | YAML-defined semantic layer, best-in-class for code-first teams | |
| Annual cost (15 users) | ●●●●● | ●●●●○ | ●●○○○ |
| ~$4,500/year ($25/user/month) | ~$9,060/year ($575/mo + $12/user/month) | ~$36,000/year ($3,000/month flat) | |
| Maintenance burden | ●●●●● | ●●●●○ | ●●●●● |
| Fully managed cloud, no DevOps needed | Cloud is managed but updates and configuration require some attention | Fully managed cloud, no DevOps needed | |
| Recommendation | Best fit for Verdure | Good alternative | Best for larger or more technical teams |
Lightdash Cloud is the strongest tool for teams with dedicated data engineers and code-first workflows, but at $3,000/month flat rate it is significantly overpriced for Verdure's 15-user team. Steep provides the right balance of simplicity, governed metrics, and cost for Verdure's current stage. If Verdure grows to 50+ BI users or hires a data engineering team, Lightdash Cloud becomes worth re-evaluating.
12-Month Cost Estimate
The table below estimates the total cost of ownership for the recommended architecture over the first 12 months, including the Nimzo Data implementation fee and ongoing infrastructure costs.
| Component | Monthly | Annual | Notes |
|---|---|---|---|
| Airbyte Cloud | ~€175 | ~€2,100 | 4 connectors (Shopify, Stripe, Meta Ads, Klaviyo) |
| BigQuery | ~€150 | ~€1,800 | On-demand pricing, based on anticipated query volume + storage |
| GA4 BigQuery export | Free | Free | Native GA4 feature, all 5 properties |
| Google Ads Data Transfer | Free | Free | Native GCP feature |
| Google Sheets external tables | Free | Free | Direct BigQuery connection to Google Sheets |
| Dataform | Free | Free | Included in BigQuery |
| Steep (15 users) | ~€345 | ~€4,140 | Business plan, $25/user/month |
| Google Cloud (misc) | ~€30 | ~€360 | Cloud Scheduler, logging, monitoring |
| Nimzo Data implementation | — | ~€20,000 | One-time fixed-price build (see proposal), excluding audit fee |
| Total Year 1 | — | ~€28,400 | Implementation + infrastructure |
| Ongoing (Year 2+) | ~€700 | ~€8,400 | Infrastructure only |
Estimates are based on anticipated usage and current pricing from each tool provider. Actual costs may vary based on data volume growth and usage patterns.
Comparison with current costs
| Current (annual) | Year 1 (recommended) | Year 2+ (recommended) | |
|---|---|---|---|
| Tools and infrastructure | €0 (free tools only) | ~€8,400 | ~€8,400 |
| Manual labor (data tasks) | ~€37,200 | ~€5,700 | ~€5,700 |
| Nimzo Data implementation | — | ~€20,000 | — |
| Nimzo Data audit | — | ~€4,000 | — |
| Total | ~€37,200 | ~€38,100 | ~€14,100 |
Year 1 total (~€38,100, including the audit fee) is close to the current annual cost of manual labor alone (€37,200). From Year 2 onward, the total annual cost drops to approximately €14,100, a savings of ~€23,000 per year compared to today. This savings comes primarily from automating Emma's 14 hours/week of manual work down to an estimated 2-3 hours/week of dashboard review and maintenance.
This calculation does not include the value of better marketing attribution. At €2.4M annual ad spend, even a 5% improvement in channel allocation efficiency would recover €120,000 per year, which far exceeds the infrastructure investment.
Implementation Plan
The following is a high-level implementation plan for the recommended architecture. A detailed scope, timeline, and fixed-price proposal accompanies this deliverable.
| Phase | Duration | What gets built | Depends on |
|---|---|---|---|
| Phase 1: Ingestion | 2 weeks | Airbyte Cloud setup for 4 sources (Shopify, Stripe, Meta Ads, Klaviyo). GA4 BigQuery export enabled on all 5 market properties. Google Ads Data Transfer Service configured. Supplier cost Google Sheet connected as BigQuery external table. | Access to Shopify, Stripe, GA4, Google Ads, Meta Ads, Klaviyo, a Google Cloud project, and an Airbyte Cloud account |
| Phase 2: Transformation | 3 weeks | Dataform project: staging models for all sources, intermediate models (Shopify-Stripe reconciliation, GA4 session-based attribution, product-cost matching, Klaviyo-Shopify email attribution), mart models (revenue, attribution, margins, LTV) | Phase 1 complete |
| Phase 3: BI and analytics | 2 weeks | Steep setup, metric definitions, AI configuration, initial views for leadership/marketing/product, training session for Emma and Lisa | Phase 2 complete |
| Handover | 1 week | Documentation, architecture walkthrough, Dataform codebase review with Emma | Phase 3 complete |
| Support window | 30 days | Support for questions, minor adjustments, and bug fixes | Handover complete |
Estimated total duration: 8-9 weeks from kickoff to handover.
What partial implementation delivers
Each phase is self-contained and delivers value on its own:
- Phase 1 alone (ingestion): Automates all data collection into BigQuery. Emma no longer needs to export CSVs from Shopify or download Stripe reports. Data refreshes daily, automatically. However, without Phase 2, the data is raw and unreconciled.
- Phase 1 + 2 (ingestion + transformation): Gives Verdure a governed data warehouse with a single source of truth for revenue, attribution, margins, and customer LTV. Queryable directly in BigQuery. However, self-service exploration for non-technical users still requires Emma to write SQL queries on their behalf.
- All three phases: The full platform as recommended. Self-service analytics for the entire leadership team, governed metrics, and an analyst freed up to do analysis rather than data collection.
Risks and Considerations
Data quality at source
We found approximately 8% duplicate customer records in Shopify (from guest checkout) and 12% of products that cannot be matched between Shopify and the supplier cost spreadsheet due to naming inconsistencies. The transformation layer will handle deduplication and best-effort matching, but the root cause should be addressed at the source: enforcing account creation at checkout and aligning product SKUs between Shopify and supplier catalogs. Without this, data quality issues will persist in the mart layer.
UTM discipline
The attribution model uses GA4 session data to link ad clicks to purchases. In the Netherlands, GA4 tracking coverage is estimated at 60-70% of purchases after accounting for consent rejection, ad blockers, and iOS privacy restrictions. This is a structural industry limitation, not a fixable implementation problem. The model is designed to work within this constraint: order-level attribution covers the tracked portion, while channel-level spend-vs-revenue comparison covers the full picture. UTM parameters on campaign URLs remain essential for campaign-level granularity, especially for Meta Ads where platform-level click tracking is less reliable than Google Ads. We recommend adding UTM validation to the team's campaign launch checklist and periodically auditing UTM coverage in GA4 (the transformation layer can flag sessions with missing or malformed UTMs).
Dutch payment flows
iDEAL, the dominant payment method in the Netherlands, redirects users away from Shopify during checkout and back after payment. This redirect can break GA4 session continuity, reducing attribution coverage for orders paid via iDEAL. This should be tested explicitly during implementation.
Team capacity and role change
After implementation, Emma's role shifts from data collection and report building to data platform stewardship: monitoring pipelines, maintaining metric definitions, answering strategic analytical questions, and training colleagues on self-service exploration. This is a more valuable role, but it is a change, and Emma should be involved in the transition planning. The training session in Phase 3 and the 30-day support window are designed to support this.
Post-implementation maintenance
The recommended stack (Airbyte Cloud, BigQuery, Dataform, Steep) is designed for minimal maintenance. All components are fully managed cloud services. However, maintenance is not zero: Airbyte connectors occasionally require attention when source APIs change, Dataform models need updating when business logic evolves, and Steep metric definitions should be reviewed as new data needs emerge. At Verdure's current scale, this is approximately 2-3 hours per week of Emma's time. If Verdure needs ongoing support beyond what Emma can handle, Nimzo Data offers monthly retainer arrangements.
Next Steps
This deliverable was discussed on the recommendation call on March 18, 2026. A fixed-price implementation proposal accompanies this deliverable.
- If you choose to proceed: The proposal is ready to sign. We can begin as soon as access to Shopify, Stripe, GA4, Google Ads, Meta Ads, and Klaviyo is confirmed, along with a Google Cloud project for BigQuery and an Airbyte Cloud account. Steep can be set up during Phase 3.
- If you choose not to proceed: This deliverable is yours to keep. You can use it as a brief for another provider or as a reference for internal planning. The quick wins are actionable regardless.
- If you have questions: You can reach out for 14 days after the recommendation call with follow-up questions, clarifications, or challenges to any recommendation. This is included in the audit fee.
Antoine Anicotte
Founder, Nimzo Data
antoine@nimzodata.com | nimzodata.com